
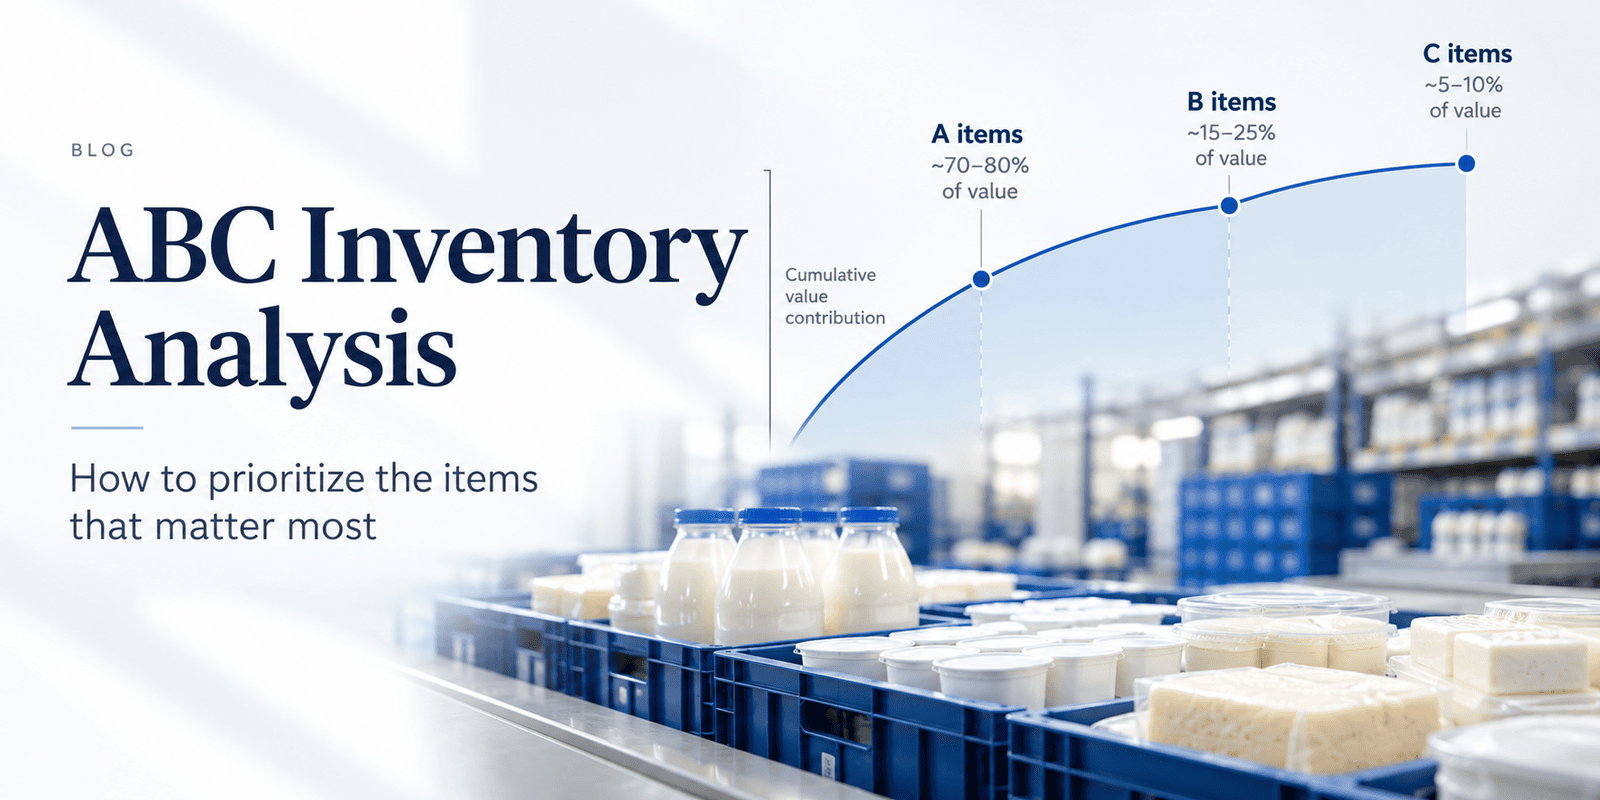
Not every inventory item deserves the same level of attention. ABC analysis helps businesses direct their control, working capital and management effort towards the items that matter most.
Inventory management is often approached as a problem of quantity. Businesses track how many products they hold, how much space those products occupy and how frequently they replenish them. But these measures alone do not tell managers where to focus. A warehouse may contain thousands of SKUs, yet a relatively small proportion may account for most of its annual inventory consumption value. Some products require tight purchasing controls and frequent reviews, while others can be managed with simpler replenishment rules. Treating every SKU identically creates two problems. High-value items may receive insufficient attention, while low-value items consume disproportionate amounts of managerial time.
ABC inventory analysis addresses this imbalance by classifying inventory according to its economic importance. It provides a structured way to determine which items require the closest control, which need periodic review and which can be managed through simpler processes. The objective is not to make inventory management more complicated. It is to concentrate effort where it can have the greatest impact.
1. The inventory management problem is not evenly distributed
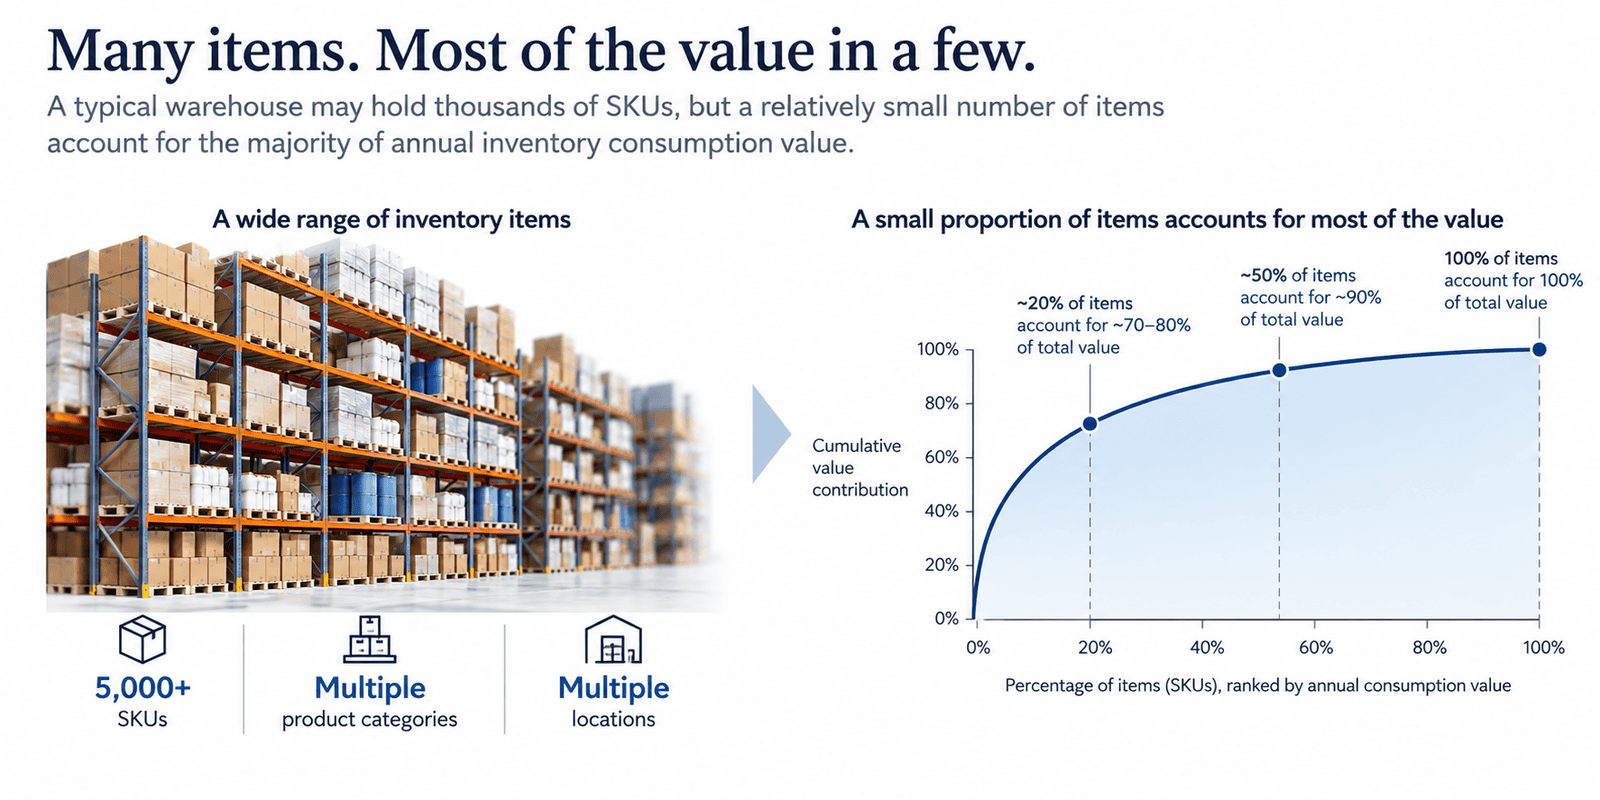
Consider a business managing 5,000 SKUs across multiple warehouses and distribution centres. Reviewing every item with the same frequency may appear consistent, but it is rarely the most effective use of time.
Some SKUs account for a substantial share of annual inventory consumption value. Others contribute relatively little, even when their total unit volumes are high.
This distinction matters because inventory decisions have different financial consequences.
An inaccurate forecast for a high-value item can tie up significant working capital. An unnecessary purchase can leave the business holding expensive, slow-moving stock. A stockout can interrupt sales or production. By contrast, a minor error involving a low-value item may have a much smaller financial effect.
The right response is not to neglect smaller items. It is to differentiate the level of control according to the consequences of getting a decision wrong. ABC analysis provides a practical starting point for doing this.
2. What is ABC inventory analysis?
ABC analysis is an inventory classification method that ranks items according to their contribution to a selected measure of value. In its conventional form, that measure is annual consumption value.
Each item is assigned to one of three classes:
A items: The highest-value items, which account for a large proportion of total annual consumption value and generally warrant the tightest controls.
B items: Items with a moderate contribution to total value, requiring structured but less intensive monitoring.
C items: Items that contribute relatively little to total value and can often be managed with simpler controls.
The underlying logic is straightforward: the economic importance of an item should influence how closely it is managed.
A commonly used starting point is to classify items so that A items account for approximately 70–80% of total value, B items account for the next 15–25%, and C items account for the remaining value.
These percentages are guidelines, not universal rules. Actual cut-offs should reflect the organisation’s inventory profile, operating constraints and control requirements.
There is also an important distinction between value and volume. A product purchased in large quantities is not automatically an A item. A product with a high unit cost is not automatically an A item either. The classification depends on the item's contribution to the chosen value measure.
Why the distinction matters
Suppose two products are held in inventory:
Product X consumes 100,000 units annually at a cost of ₹20 per unit.
Product Y consumes 2,000 units annually at a cost of ₹300 per unit.
Their annual consumption values are:
| Measure | Product X | Product Y |
|---|---|---|
| Annual consumption | 100,000 units | 2,000 units |
| Unit cost | ₹20 | ₹300 |
| Annual consumption value | ₹20 lakh | ₹6 lakh |
Product X has a much higher annual consumption value, despite its lower unit cost. Product Y has a higher cost per unit, but a lower total contribution. ABC classification captures this difference by considering both usage and cost.
3. How to perform ABC inventory analysis: a step-by-step approach
ABC analysis is relatively straightforward to calculate. Its value depends on the quality of the underlying data and how the resulting classifications influence inventory decisions.
The following five steps provide a practical method.
Step 1: Calculate the annual consumption value of each item
Start with a list of inventory items and collect two inputs for each SKU:
Annual consumption quantity.
Unit cost.
Calculate annual consumption value using the formula:
Annual consumption value = Annual consumption quantity × Unit cost
For example, an item consumed 40,000 times during the year at a unit cost of ₹50 has an annual consumption value of ₹20 lakh. Use a consistent cost basis across the inventory portfolio. Depending on the business, this may be the relevant purchase or standard cost, with an agreed treatment of freight, duties and other applicable costs.
The time period must also be consistent. Many businesses begin with the preceding 12 months, although seasonal products may require a more representative period or a separate treatment of seasonality.
A practical consideration: Annual consumption value is not the same as the value of stock currently on hand. Annual consumption value measures the economic flow through inventory; current stock value measures the capital tied up in inventory at a point in time. Both are useful, but they answer different questions.
Step 2: Rank inventory items from highest to lowest value
Once annual consumption value has been calculated, arrange SKUs in descending order.
The highest-value item comes first, followed by the next highest, until the lowest-value item appears at the bottom of the list.
This creates a value-ranked inventory register rather than a simple list organised by product name, warehouse or quantity.
The ranking makes the concentration of value visible. It also establishes the order used to calculate cumulative contribution in the next step.
Step 3: Calculate each item's percentage contribution
Calculate the total annual consumption value across all included SKUs.
Then calculate the percentage contribution of each item:
Item value contribution (%) = Item's annual consumption value ÷ Total annual consumption value × 100
Suppose the total annual consumption value of a business is ₹1 crore and one SKU contributes ₹15 lakh. That SKU accounts for 15% of the total. This step converts absolute monetary values into a common measure that allows different SKUs to be compared.
Step 4: Calculate cumulative value contribution
The percentage contribution of an individual item tells managers how important that item is on its own. The cumulative percentage shows how much of the total value has been accounted for as the ranked list progresses.
To calculate it, add each item's percentage contribution to the cumulative percentage of the items above it.
For example, if the first three items contribute 30%, 22% and 15%, their cumulative contribution is:
First item: 30%.
First two items: 52%.
First three items: 67%.
The cumulative percentage is the key input for ABC classification. It reveals where the organisation's value is concentrated and provides a basis for setting classification boundaries.
Step 5: Assign the A, B and C categories
Finally, classify the ranked items using the organisation's chosen cumulative value thresholds.
A common starting framework is:
| Category | Typical share of total value | Primary management approach |
|---|---|---|
| A | First 70–80% | Tight controls and frequent review |
| B | Next 15–25% | Structured, periodic review |
| C | Remaining value | Simplified controls and efficient replenishment |
The classification should follow the cumulative value curve, with practical adjustments where appropriate. Businesses do not need to force every inventory portfolio into identical percentages. The important outcome is a defensible prioritisation of items, not a perfect fit to a predetermined ratio.
4. What should change after classification?
ABC analysis is not the end of inventory management. It is the input to a more differentiated operating model.
If every SKU continues to be reviewed, replenished and monitored exactly as before, classification creates little practical benefit. The real value comes from translating each category into distinct policies.
A items: focus on control and decision quality
A items make the largest contribution to annual consumption value and generally warrant the strongest oversight.
Businesses may choose to apply:
More frequent inventory reviews.
Tighter replenishment and purchasing controls.
Greater scrutiny of demand assumptions and forecast changes.
Closer monitoring of stock availability and inventory accuracy.
More regular reviews of excess stock and working-capital exposure.
The purpose is not to create unnecessary bureaucracy. It is to reduce the financial consequences of poor inventory decisions where the stakes are highest.
B items: maintain disciplined, proportionate control
B items require a structured approach, but the review intensity may be lower than for A items.
Depending on demand patterns and operating requirements, this may involve periodic stock reviews, planned replenishment checks and exception-based monitoring.
The objective is to maintain service and availability without devoting the same management effort to every decision.
C items: simplify routine inventory management
C items contribute relatively little to total annual consumption value. For suitable items, simpler controls can reduce administrative effort.
Possible approaches include standard replenishment rules, less frequent manual review and exception-based alerts.
However, low financial value must not be confused with low operational importance. A low-cost component that stops a production line, a legally required item or a product with a critical customer commitment may need strict controls irrespective of its ABC class.
The principle is proportionality, not neglect.
A practical policy framework
| Decision area | A items | B items | C items |
|---|---|---|---|
| Review frequency | Frequent | Periodic | Routine or exception-based |
| Replenishment oversight | Tight | Structured | Simplified where suitable |
| Forecast review | High priority | Regular review | More automated where suitable |
| Inventory accuracy | High-priority verification | Standard verification | Risk-based verification |
| Management attention | Highest | Moderate | Focused on exceptions |
The table is a starting point, not a universal policy. Review frequency, safety stock and replenishment rules should also depend on demand variability, lead times, service commitments and the cost of a stockout.
5. Why ABC analysis alone is not enough
ABC analysis provides a useful economic prioritisation, but it does not capture every inventory risk.
An item's annual consumption value does not tell a manager whether demand is volatile, stock is about to expire, a supplier is unreliable or a stockout would disrupt a critical operation.
Two items in the same ABC category can therefore require very different decisions.
A high-value item with stable demand and a short replenishment lead time may be relatively easy to manage. Another high-value item with irregular demand and a long lead time may require more safety stock and closer monitoring.
Likewise, a C item with a low financial contribution may still create an immediate operational problem if it is unavailable or close to expiry.
This creates an important distinction:
ABC analysis tells the business where value is concentrated. It does not, by itself, tell the business where risk is concentrated. A more complete inventory management approach combines value classification with operational risk signals.
Introduce additional dimensions of inventory risk
Depending on the business, useful complementary measures may include:
Demand variability: How predictable is consumption?
Lead time: How long does replenishment take, and how reliable is that time?
Shelf life: How much usable life remains before the product expires?
Stockout exposure: Is the projected inventory sufficient to meet near-term demand?
Excess and slow-moving stock: Is capital tied up in inventory that is unlikely to be consumed as expected?
Criticality: Would a shortage interrupt production, fulfilment or an important customer commitment?
These dimensions should complement ABC analysis rather than be forced into it.
For example, a company could retain its ABC classification while separately identifying items with high expiry exposure or stockout risk. This produces a more useful decision framework than attempting to make one classification represent every kind of risk.
Prioritize value, then manage risk
ABC inventory analysis offers a simple but powerful lesson: inventory items do not contribute equally to a business's economic exposure, so they should not automatically receive equal management attention. By ranking items according to annual consumption value, calculating cumulative contribution and classifying them into A, B and C categories, organisations can build a more deliberate approach to inventory control.
A items receive tighter oversight. B items receive structured review. C items are managed with proportionate, simpler controls where appropriate.
But value-based classification is only the starting point. Demand variability, replenishment lead times, criticality and, in perishable supply chains, remaining shelf life can materially change the decision that needs to be made today.
The broader lesson is straightforward: use value to establish priorities, use operational risk to determine urgency, and use clear policies to translate both into action.
That is how ABC analysis moves beyond categorising inventory to helping a business manage it more intelligently.
Scaling a food, dairy, or frozen distribution business and want a clearer view across your warehouse, fleet, and sell-through data? Connect with Hopnet for a free strategy session and a roadmap tailored to how your supply chain actually runs today.